
Sea Level Rise
Research
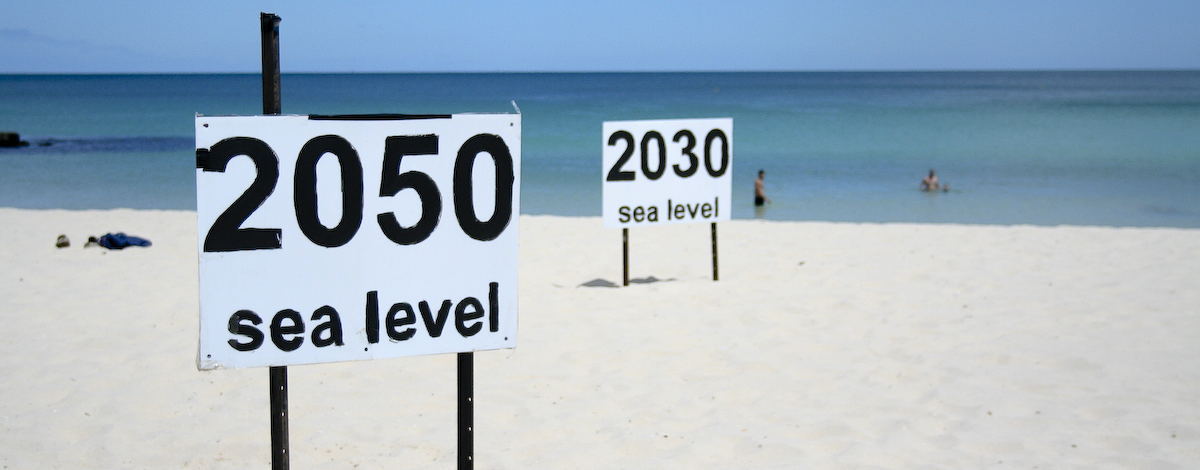
Tide gauges and historic records give us a track record for normal sea level and how it has changed during the recent decades. Research studies comparing tide gauge data to historic tidal data have shown an increase in sea level. The causes of sea level rise, thermal expansion and ice melt, coincide with an increase in global temperature. Some sea level rise research works to estimate how much it will rise over the next 100 years, and how coastal communities can prepare for the impacts of changing sea level. This research benefits millions of people living in coastal communities around the globe!
Research Areas
Tide Gauges
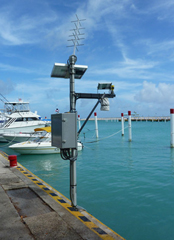
Tide gauge1
These are devices permanently installed in coastal areas around the world, and they constantly measure both the tides and the sea level in general. Gauges of different types have been used for over 150 years to record mostly tidal data, but more recently have been used to measure the overall sea surface level. The data collected from these gauges is combined with satellite data to produce a highly accurate record of sea level trends. These records help scientists and policy makers understand how sea level has changed, and it can be used to model future changes and impacts.
Satellites
The first satellite, named TOPEX/Poseidon, used to measure sea level!2
Satellites provide a unique benefit over tidal gauges when observing sea level: they can quickly give a global picture versus the specific point of data provided by a stationary tide gauge. Gauges can confirm on the ground what the satellites are seeing from the sky. Satellites measure the distance between itself and the sea surface. NASA, NOAA and other partners began taking these measurements in 1992!
Proxy Data
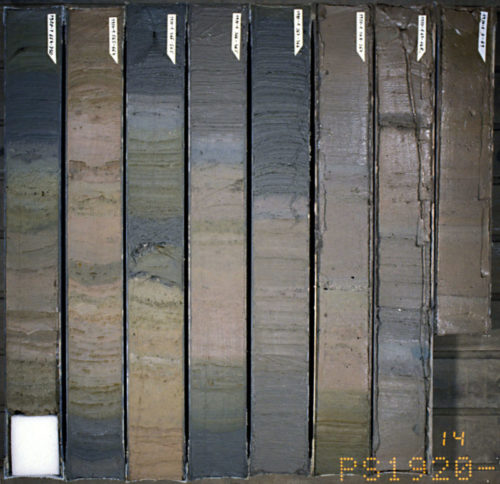
Ocean sediment cores taken off of Greenland. Look closely and you’ll see individual layers!3
Just like how a river leaves evidence of its presence behind when it moves, the sea leaves its own footprint. Scientists take deep ocean cores that provide a layer by layer record of ocean conditions from the past. Fossils and sediment in these cores are used to create a historic picture of how the sea level has changed. Sometimes old sea bed layers are exposed because of earthquakes or glacial activity, and scientists can study these records as well.
Follow links below to learn more about sea level rise research:
- Sea Level Change from NASA – A robust resource provided by NOAA that includes information on the causes of SLR, observations, projections, and impacts on communities. I highly recommend visiting this link!!
- Changes in sea level data both satellite and gauge records – This link will show you two graphs with historical data from tidal gauges and more recent data from satellites. Graphs are reporting the variation in sea level, which means how the sea level has changed from what has been considered normal.
- SLR and flooding impacts – This map allows you to explore the impacts of sea level rise on coastal communities.
- Sea Level trends – An interactive map that shows trends in sea level around the world. Arrows point up or down depending on if the sea level has been rising or falling. Click on an arrow to read more about the trend, and find links to maps and other information. It’s a great visual example of how sea level changes depend on the area you’re studying. How do arrows in Washington compare to arrows in the Gulf of Mexico?
- Frequently Asked Questions from NOAA – A great resource to simply look through! It has questions about the oceans in general, not just sea level rise, so find answers to questions you haven’t even considered yet!
Photo Credits: