Climate Change
Research
In order to understand climate trends and changes we track various environmental conditions including daily rainfall, CO2 concentration in the atmosphere, ice melt, sea level surface temperature, and much more. Scientists use these datasets to find trends or cycles that lead to understanding of how the climate functions and how it is changing. Below you’ll find links to NOAA data sets, important research that led to understanding climate change, and links for understanding climate data analysis.
Mauna Loa Observatory
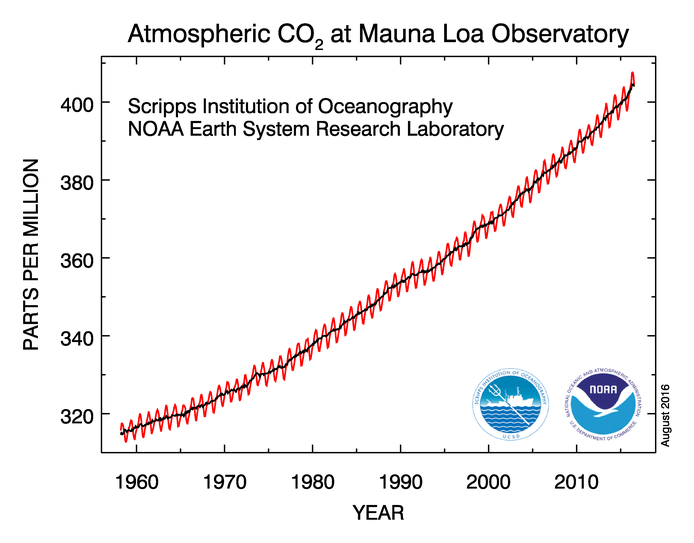
The Keeling Curve. Source: NOAA ESRL1
The Mauna Loa Observatory is an “atomspheric baseline station” located on Mauna Loa in Hawaii. It began taking daily measurements of gases in the atmosphere in 1956 and has successfully provided scientist with baseline data of atmospheric gas concentration. The graph of atmospheric carbon dioxide the site has generated is referred to as the Keeling Curve, and provided some of the first hard evidence for the rapid increase of carbon dioxide in the atmosphere. Click here to explore the Keeling Curve Data Set.
Ice Cores
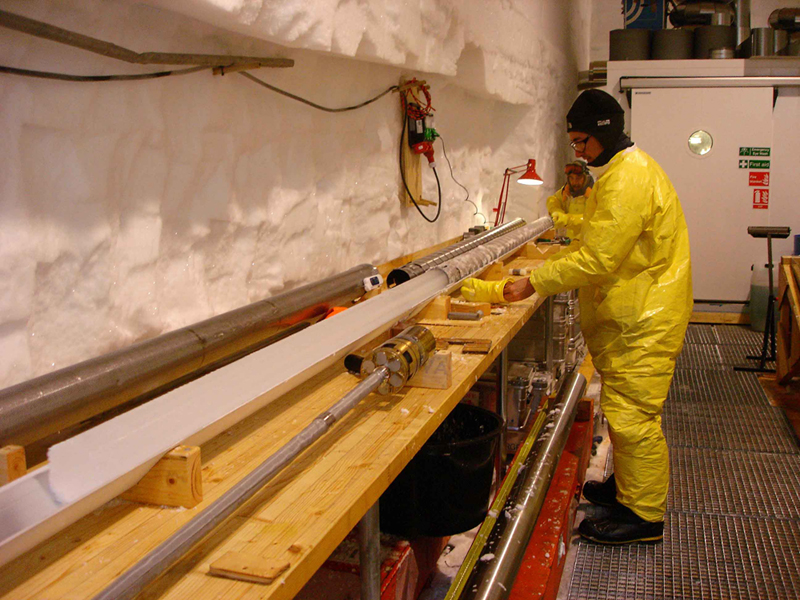
Ice core sample removed from a drill. Source: NEEM2
Ice cores provide important historical data of previous climate conditions. We take cores from ice sheets in Antartica, Greenland, and glaciers on mountains. These ice sheets form over time with each new layer of snow, which allows for small air bubbles to become trapped in the ice. The trapped air is a small sample of the gases in the air, and scientists can carefully test these bubbles to get an idea of what previous atmospheres were like. Ice cores have allowed us to understand how Earth’s climate has changed over time, and how the current change in climate compares to previous climate changes. For more information on how cores are taken and studied visit the National Ice Core Laboratory’s website.
Global Temperature
The average global temperature is connected to the amount of CO2 in the atmosphere because CO2 acts as an insulator for the Earth, similar to a blanket. Tracking global average temperature helps scientists model the future climate. You can track this and other “Earth Vital Signs” through NASA’s climate website at: http://climate.nasa.gov/vital-signs/global-temperature/
More Links
NOAA’s Climate Data Primer explains different tools used and how climate data is processed and analyzed.
CO2 measurements taken from the Space Needle: http://www.pmel.noaa.gov/co2/story/Space+Needle
Washington State emissions: http://www.pmel.noaa.gov/co2/story/WA+State+Emissions
Climate change indicators from Global Change: http://www.globalchange.gov/browse/indicators
Photo Credits:
- Keeling Curve – Image provided by NOAA ESRL Global Monitoring Division, Boulder, Colorado, USA (http://www.esrl.noaa.gov/gmd/obop/mlo/)
- Ice Core – Photo by NEEM ice core drilling project (www.neem.ku.dk)